It’s time to automate your model syncs and never look back
See how Revizto fits your workflow
Coordination data only earns its place in a client conversation if it's easy to read at a glance. A weekly reporting rhythm, built on automated model syncs and a single clear trend chart, does more for client trust than a dense clash report ever will — because it turns a status update into something both sides can actually look at and discuss.
Jason Howden, now Chief Innovation Officer at Revizto, saw that shift play out running BIM coordination at Warren & Mahoney, a New Zealand and Australia-based architecture practice, before he joined the company. Speaking at Revizto's first RevUp event, he described how one dashboard chart changed the way his team talked to clients about project health.
An automated weekly cycle removes the manual admin
A weekly cycle works because it's not dependent on someone remembering to run it. Models sync to the cloud every night, so the information waiting for the team each morning is already current, and coordination sessions and clash detection run on that same weekly rhythm — giving people time to resolve what the automation surfaces instead of chasing it down by hand.
Howden's team nicknamed the automated part of that cycle SAM. "He's the hardest worker. He works 24/7, works weekends, never complains," he said of it — a joke that stuck because it captured something real: the reporting didn't depend on anyone's memory.
A simple chart clients actually understand
A basic trend line, tracking open issues over time, tells a non-technical audience more than a full clash report ever will. A line trending up signals active design work. A flattening line signals most components are in place. A dropping line signals coordination is working.
That simplicity is what makes it useful in client conversations. On Howden's projects, when the line spiked instead of dropping, the project manager would ask why — and the answer was usually a specific, traceable design change, like a plant room that had moved late in the process. Instead of a vague status update, the chart gave the team and the client a shared, concrete thing to point at and discuss.
Dashboards can make coordination meetings shorter, not longer
The same weekly rhythm can feed dashboards that make progress visible without turning coordination into a chore. On Howden's team, subtrades started treating their open issue lists like something to close out ahead of the next session, walking into meetings and announcing they were done before anyone asked. A short meeting became the marker of a coordination process that was actually working.
Role-specific views mean fewer meetings, not just shorter ones
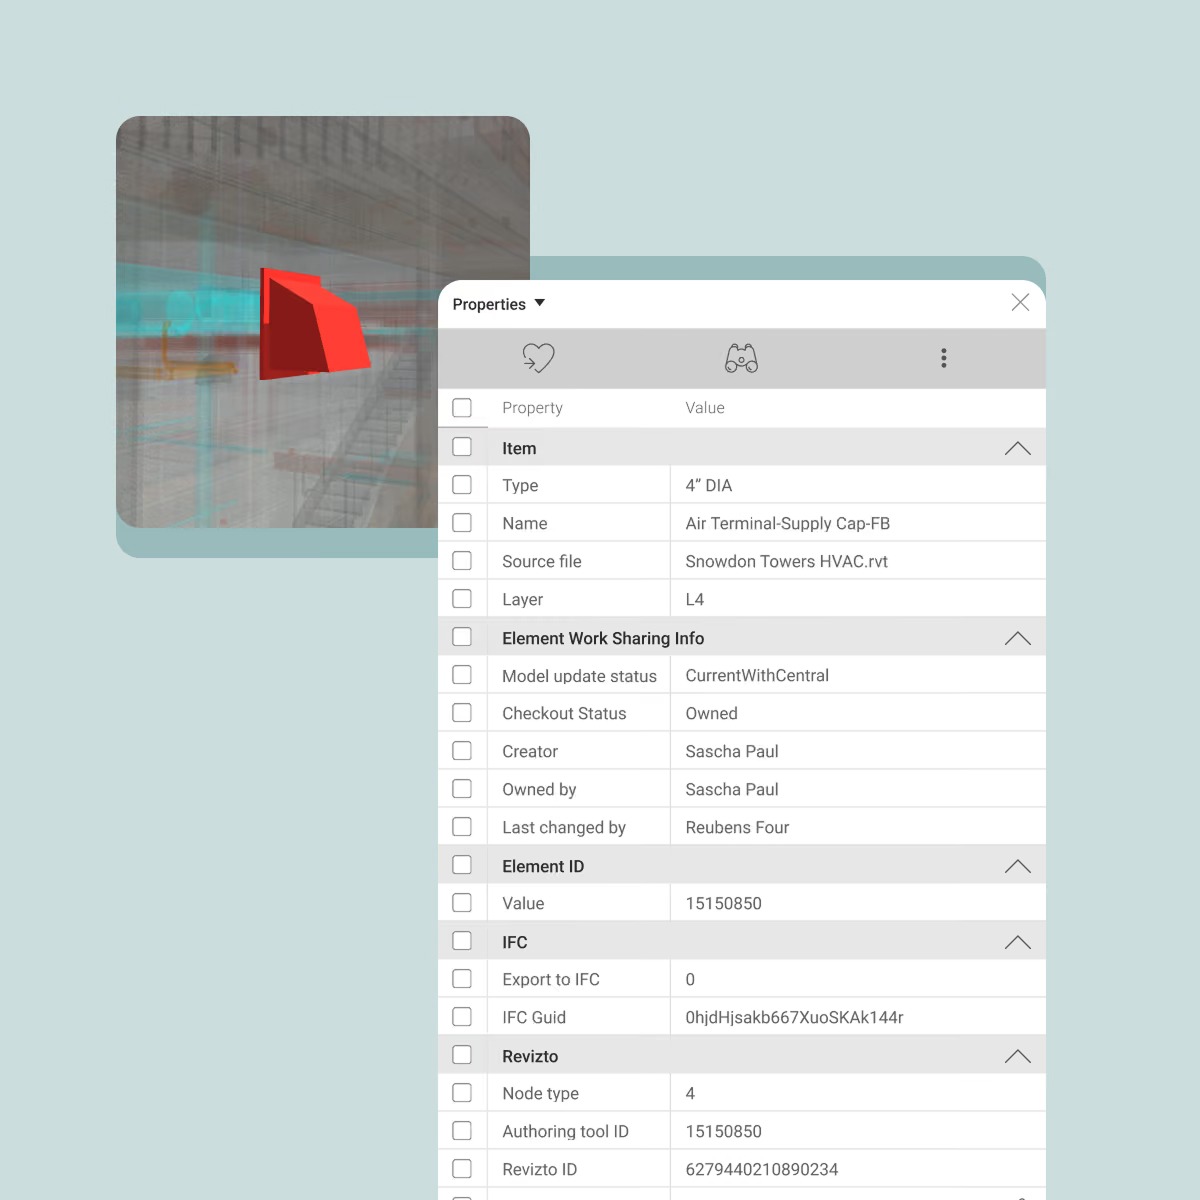
None of this depends on everyone seeing everything. An Appearance Profiler filters the same model and issue set down to what matters for each trade, so a fire contractor or a plumber can see only their own issues in a simple dropdown. Paired with issue filters and a pre-built snag list, that's usually enough for someone to get their status update without a dedicated meeting to deliver it.
Learn the setup directly
This kind of templated, automated reporting is exactly what Revizto Academy's Power BI Essentials course walks through in about 10 minutes, free, no license required: connecting Revizto to Power BI and building from preset templates instead of starting a dashboard cold.