How to leverage the Revizto Power BI connector
See how Revizto fits your workflow
Most project teams I speak to aren't short of data. They're short of visibility. The issues are tracked, the coordination is happening — but when it comes time to report on progress or explain to leadership why problems keep recurring, the data doesn't surface in the format they need.
That gap between data and decisions is what the Revizto Power BI connector is designed to close. It pulls your project data directly into Power BI, where you can build the dashboards your business actually needs, without writing a single line of code.
Connecting Revizto to your existing reporting environment
What is Power BI?
Power BI is Microsoft's business intelligence platform, and many construction organizations are already using it to consolidate data from across their operations. The Revizto connector brings your project coordination data into that same environment, so it can sit alongside information from your scheduling tools, cost platforms, and any other systems your team is already reporting from.
Setting it up requires a one-time setup: download the Revizto connectors and follow the installation instructions in Revizto's Power BI setup guide. Once that's done, open Power BI and click Get Data — you'll find the Revizto connectors listed by region. Select your region, authenticate, choose your license and project, and Power BI surfaces your Revizto data as structured tables covering issues and clashes. From there, you build your dashboards using the same tools and skills your team already has in Power BI.
No API calls. No Python scripts. No developer required.
The connector works because the Revizto API is running in the background on your behalf. That also means your access rights carry over directly: what your project role permits you to see in Revizto is exactly what the connector will give you in Power BI. Your data stays within the boundaries your project has already defined.
5 things to know about the Revizto PM Dashboard
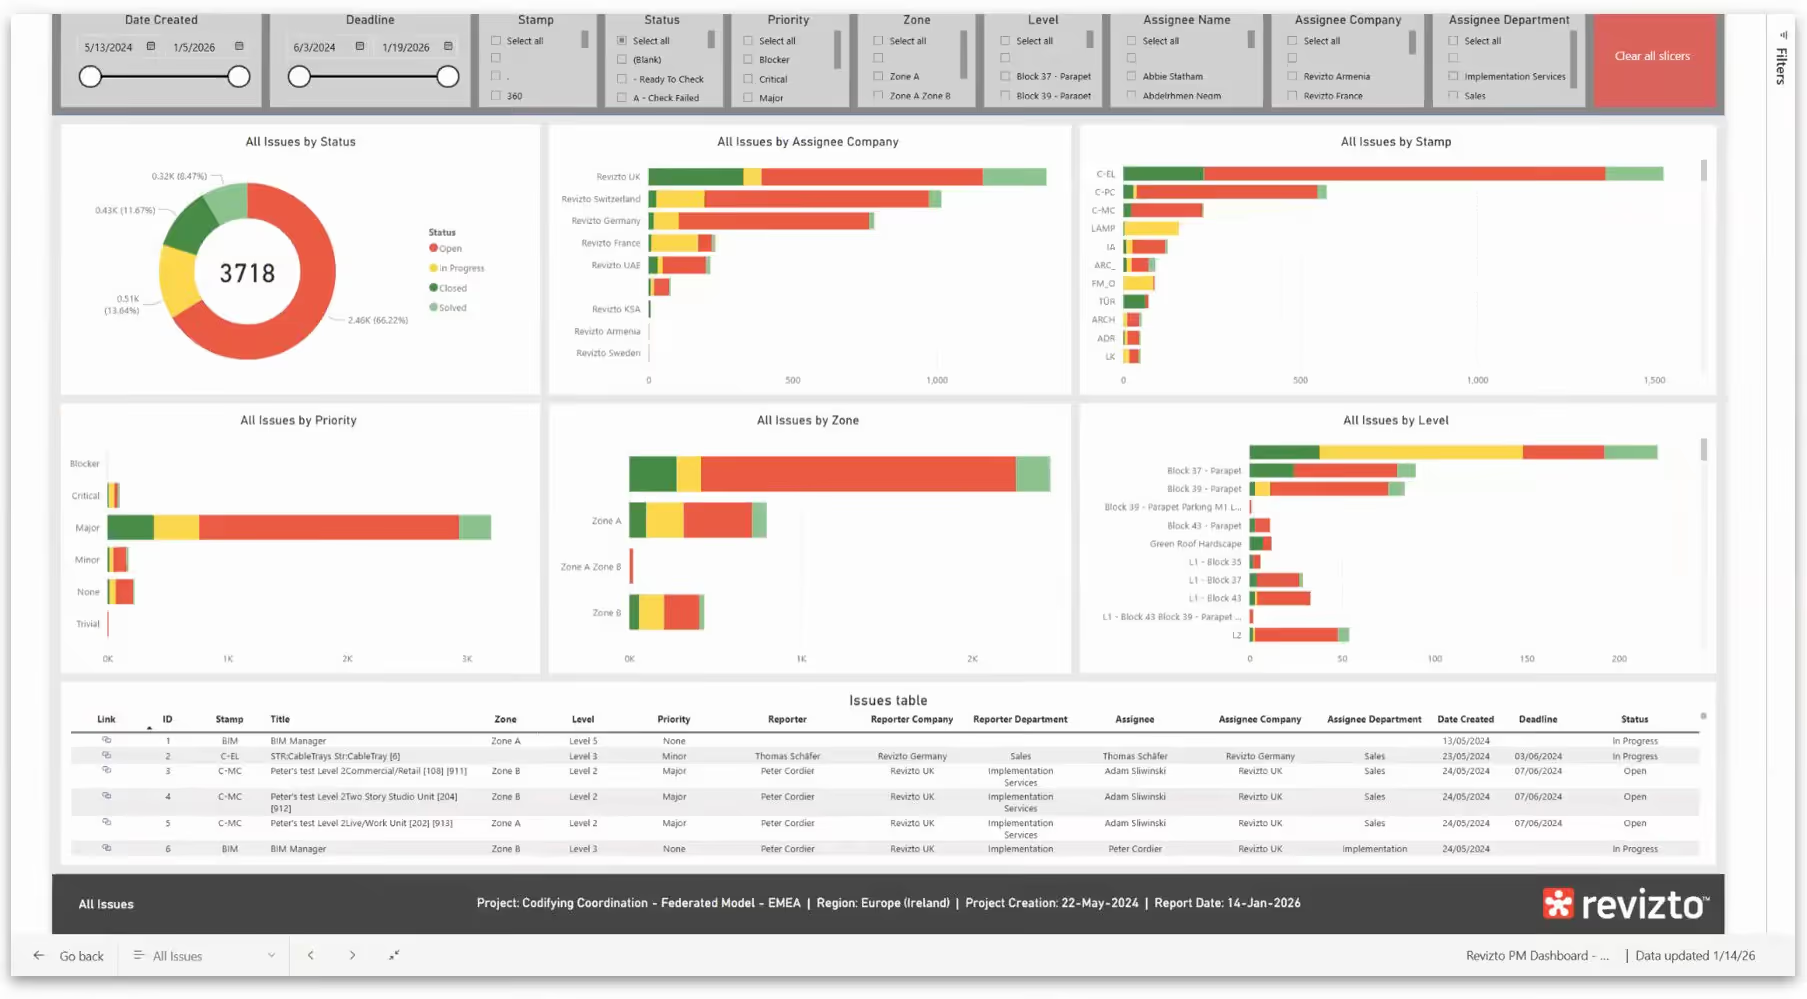
If you'd rather not build a dashboard from scratch, we've created a ready-made template that connects directly to your project and populates automatically. It's a PBIX file called the Revizto PM Dashboard, available in the miscellaneous folder when you download standard templates from any project's info page in Revizto workspace. Open it, reconnect it to your project, and the charts update to reflect your project data.
The template is built around a question I hear constantly in project reviews: not just how many issues do we have, but what is actually happening with them. Here's what it covers.
1. The full issue breakdown.
The opening view gives you all issues on the project, broken down by status, assignee company, zone, and level. A filter panel at the top lets you slice by any combination of these fields and other fields too, so a project manager can drill down to a specific package or trade in seconds rather than exporting and filtering a spreadsheet.
2. Resolved issue performance.
A dedicated view looks back at every issue that has been solved or closed, and calculates how long each one took. Not just days open, but two distinct metrics: days from creation to resolution, and days from resolution to formal closure. This separation matters. It tells you whether your teams are slow to solve issues, or whether they're solving them but no one is closing them out. You can see those averages broken down by assignee company and by individual, which is useful when you're trying to have honest conversations about accountability.
3. Issue resolution timeline.
This view plots cumulative issue creation, due dates, and resolution rates on a single chart over the life of the project. You can see at a glance whether the rate of resolution is keeping pace with the rate of creation, and identify specific periods where resolution slowed down. Those dips often correspond to something: a particularly complex design phase, a resource gap, a period of scope change. The chart makes those patterns visible rather than leaving them buried in a table.
4. Forward-looking overdue tracking.
For every issue still open or in progress, this view shows when it was created, when it's due, how many days have elapsed, and how many days remain. Issues already past their deadline appear in red. Averages by company show you not just which issues are overdue, but which teams are consistently running behind, and by how many days on average. That's a different kind of conversation to have with a subcontractor than simply saying "you have open issues."
5. Team engagement.
The final view shows you which companies have been invited to the project but have not yet accepted, or have accepted but shown no activity. On large projects with many stakeholders, it's easy for onboarding gaps to go unnoticed until they become coordination problems. This view surfaces them early.
"The template doesn't just show you where you are. It shows you how you got there, and who's responsible for what comes next."
Ahmed Abdelmeguid, Industry Consultant, Revizto
Why use this alongside Revizto's native dashboards?
Revizto's workspace includes its own interactive dashboards and reports, and for day-to-day coordination work, those are often exactly what a team needs. The Power BI connector serves a different purpose.
The main advantage is consolidation. Power BI lets you pull data from multiple sources into a single view. If your organization tracks schedule data in one platform, cost data in another, and coordination data in Revizto, the connector lets you bring those streams together. A combined dashboard showing issue concentration alongside scheduled work areas, for example, becomes a tool for proactive planning rather than reactive reporting.
The second advantage is customization. The ready-made template is a starting point, not a ceiling. Once your Revizto data is inside Power BI, you can build entirely bespoke visuals, apply your organization's own branding, embed dashboards in internal portals, and share them with stakeholders who may not have Revizto access. You're not limited to the charts and formats the platform provides. You're working with your own data, in your own environment, on your own terms.
That's ultimately what construction data ownership looks like in practice. Not just the right to store your data securely, but the ability to take it somewhere useful.
"A lot of teams are already doing the hard work of coordination. The Power BI connector makes sure that work is visible to the people who need to see it."
Ahmed Abdelmeguid, Industry Consultant, Revizto
Getting started takes less time than you think
The connector is available now. To install it, go to this Help Center article where it walks you through the installation process step by step.
For the ready-made template, go to any project in Revizto workspace, open the project info page, click Download Standard Templates, and navigate to the miscellaneous folder. The PBIX file includes reconnection instructions so your charts populate with your project's data straight away.
If you want to go further and combine Revizto data with information from other platforms, the full Revizto API gives you that capability. The API Essentials course at academy.revizto.com is a free starting point, and no prior coding experience is needed.
Have more questions? Talk to us today.

FAQs
The Revizto Power BI connector is a data integration tool that allows teams to pull issue and clash data from Revizto directly into Microsoft Power BI without writing code. It appears as a named connector in Power BI's Get Data menu, organized by Revizto region. Once connected, it surfaces your project data as structured tables that can be used to build custom dashboards and reports.
No. The connector is designed specifically for teams who want the benefits of custom reporting without needing to interact with the Revizto API directly. If you're already comfortable working in Power BI, the connector integrates with your existing workflow. Installation guidance is available at help.revizto.com.
The ready-made template is currently designed to connect to a single project. However, if you are building custom dashboards in Power BI, you can connect to multiple projects and combine the data within your own reports. For projects across different Revizto regions, each region requires its own authentication.
Currently the connector surfaces issue and clash data. Object and model metadata, which will give access to object-level properties including quantities, classification data, and custom attributes, are coming through the Revizto API this summer. Once generally available, that data can be brought into Power BI as JSON files, though it will not yet be available through the connector itself.